Electric Models: Depreciation Still Drags Down Ownership Costs
A lifecycle analysis by Vincentric found that total cost of ownership (TCO) for electric vehicles underperforms plug-in hybrid electric and traditional hybrid model counterparts. Running EVs more miles per year has a substantive positive impact on TCO.


BMW Group's range of electric models for 2021. The i3 (center, red) projected the lowest TCO for all electric models at 75,000 miles and five years of operation.
Photo courtesy of BMW Group.
As electric passenger vehicles continue to penetrate the mainstream, Fleet Forward wanted to see how electric vehicles stack up against each other in total cost of ownership (TCO), a key metric for fleets. FF collaborated with Vincentric, the lifecycle cost experts, to analyze TCO data for select battery electric vehicle (BEV) models, plug-in hybrid electric vehicle (PHEV) models, and traditional hybrid models.
For the analysis, Vincentric calculated its standard eight cost elements: depreciation, financing, fees and taxes, fuel, insurance, maintenance, opportunity cost, and repairs. This analysis covers 2021 model-year vehicles over a five-year period at both 15,000 miles a year and 20,000 miles a year. (2020-MY if data was used for that model isn’t yet available.)
Electric models enjoy federal rebates, which are crucial to lowering electric vehicles’ TCOs. The initial federal rebate of $7,500 diminishes as brands reach 200,000 units in EV sales. The Chevrolet Bolt and Tesla models have used up their rebate potential, though the Biden administration’s GREEN Act proposes to reinstate a $7,000 rebate for sales up to 600,000 units.
State programs also provide grant money for fleets, though the majority are concentrated in West Coast states. Applying grant money changes the TCO cost equation yet again, though grants were not included in these calculations.
Comparing costs for fuel, or more broadly “power,” for three propulsion types (ICE, BEV, PHEV) is an inexact science. For an apples-to-apples comparison, we needed to apply a uniform yearly mileage; however, BEVs and PHEVs are selected by fleets based on duty cycles that best fit their ranges.
Vincentric bases the “fuel” cost for BEVs and PHEVs on the average cost of electricity for each state and the EPA's measurement of total kilowatt hours used to drive the vehicle over its estimated range for a fully charged vehicle.
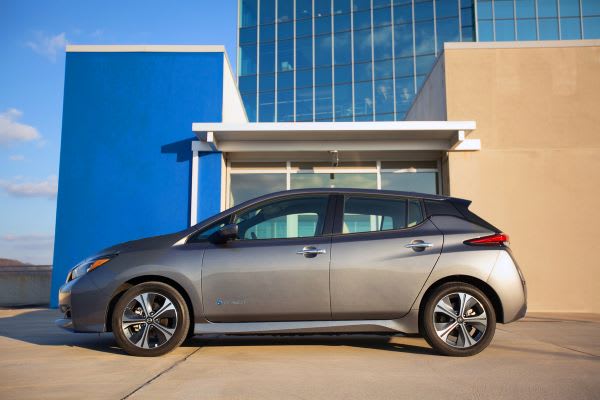
Photo courtesy of Nissan.
For plug-in hybrid vehicles, Vincentric divides the estimated annual mileage by 365 to create the daily mileage. Electric propulsion is assumed for the daily miles up to the EPA's estimated range for that vehicle. Additional mileage in excess of the EPA's estimated range assumes gas propulsion.
Fleet Forward completed a similar TCO study with Vincentric in August 2019. That study considered TCO at 15,000 miles per year for three years. For this study, we decided to elongate the hold period to five years and see how adding a 20,000-mile per year analysis affects TCO.
This study focuses purely on TCO, and does not consider other factors such as charging, driver satisfaction, environmental impact, or performance. With so many outside variables and a fast-changing market, this analysis should be considered directional at best.
Here are some conclusions from this study:
As in the 2019 study, the traditional hybrids and PHEVs are still the TCO champs over pure electric models. In this analysis of 20 models, the top 10 are almost exclusively hybrids and PHEVs.
The average TCO for the hybrids and PHEVs studied at 100,000 miles and five years was $55,778 or $.56 per mile, and for BEVs was $60,116 or $.60 per mile.
Depreciation is still the biggest cost factor putting downward pressure on TCO for BEVs. On average, the BEV models retain 26% of their original value after five years and 100,000 miles, while the PHEVs and hybrids retain 31%.
However, BEVs make up substantial ground on fuel and maintenance over five years. The BEVs project more maintenance savings ($2,743 after five years and 100,000 miles) than “fuel” savings ($2,094). Note that this analysis doesn’t take into account managed “smart” charging, which would cut charging bills even further.
Running electric vehicles more miles per year — in this case 100,000 miles over 75,000 miles — does result in a lower cost per mile as it maximizes electrification’s fuel/power savings advantage. The average cost per mile for BEVs running 15,000 miles per year was $.69 cents per mile, while that figure dropped to $.60 cents per mile at 20,000 miles for the same vehicles. The PHEVs and hybrids improved as well over the same mileage comparison, but only by $.04 per mile.
Looking at specific models, Nissan Leaf and BMW i3 lead the TCO pack for BEVs. The Tesla Model 3 falls in the middle, with Tesla’s luxury Model X and Model S fall to the bottom. The absence of federal rebates for Teslas play a factor.
As expected, luxury BEVs and PHEVs with acquisition costs over $50,000 have much higher TCOs and take up the bottom of the list — like their ICE counterparts.
Originally posted on Automotive Fleet
More Electric Vehicles

California Governor Approves Instant ZEV Rebates For First-Time Buyers
That instant rebate is the centerpiece of a broader $600 million package Governor Newsom signed into law, keeping California active in the global clean transportation race.
Read More →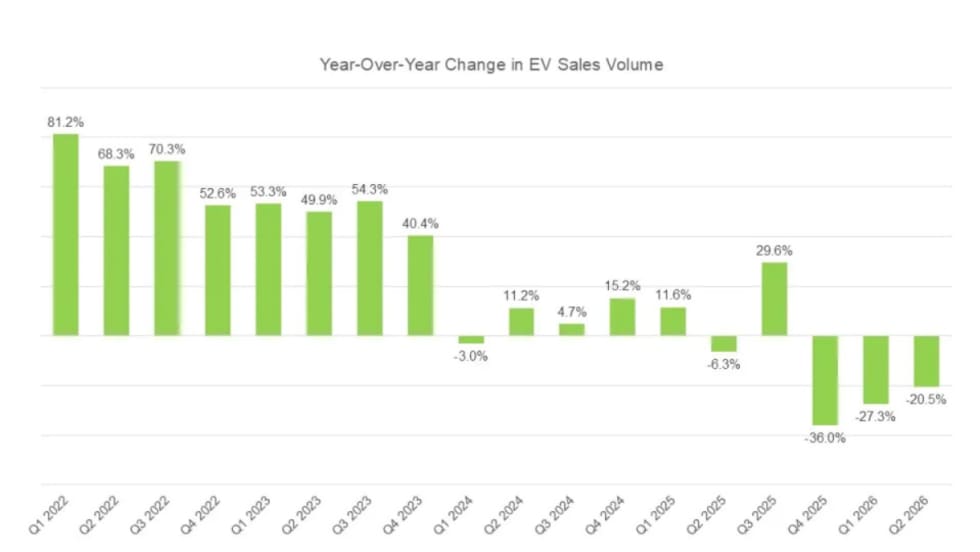
New Vehicle Models Stabilize Electrified Market In Q2
But more credit goes to hybrids than to all-electric vehicles, as more buyers look for fuel-efficient alternatives amid high gas prices.
Read More →
Xos White Paper Asserts LA Olympics Will Lack Enough EV Chargers
The commercial EV fleet company recommends some faster and more flexible remedies to relieve the anticipated shortfall.
Read More →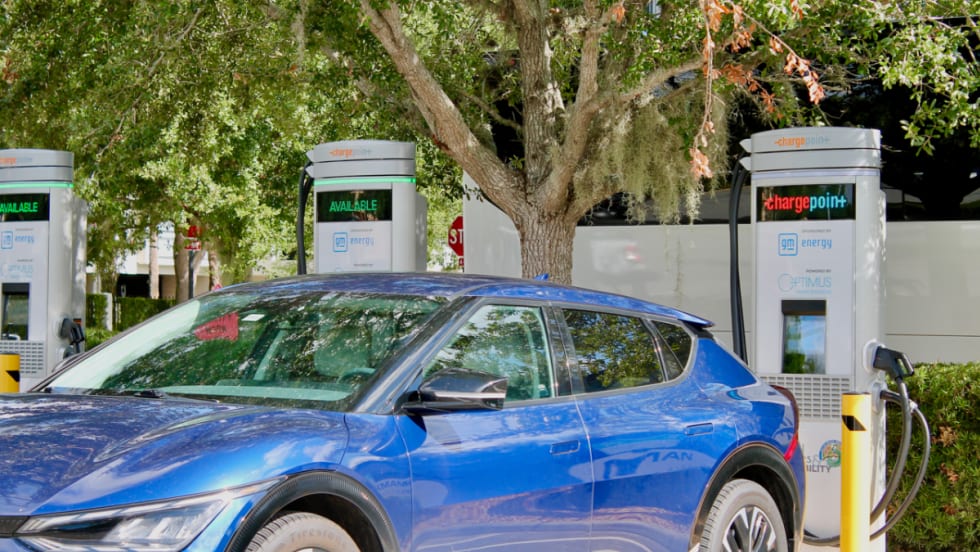
ChargePoint, Optimus Expand Fast-Charging Network Across Southeastern U.S.
ChargePoint will serve as the exclusive solutions provider, delivering hardware, software, and services to support Optimus’ growing charging network.
Read More →
Running A Profitable Electric Rental Fleet
How do you successfully operate an all-electric rental car fleet? Whether you manage a rental fleet or another commercial fleet, this conversation offers practical lessons on deploying, operating, and scaling electric vehicles.
Read More →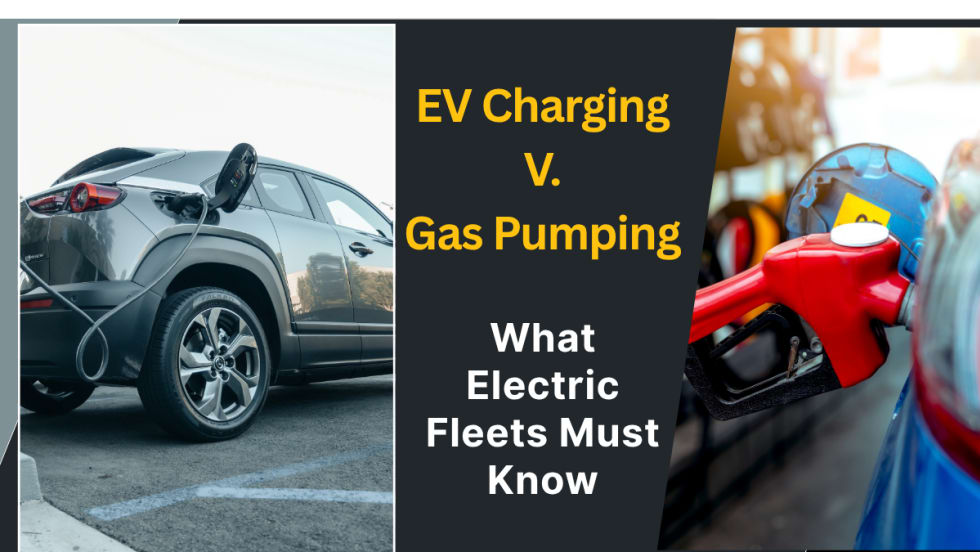
Why Charging May Never Be As Easy As Filling Up Gas
A seamless charge depends on a string of independent companies getting it right together, every time. How can electric fleets navigate the challenges to create a successful charging plan?
Read More →
Slate Debuts Colorful, Unique EV Models
A recent media and client event, studded with electric vehicles dressed up on platforms, planted a new position for the manufacturer in the wider EV market. Fleets will find cost-saving advantages.
Read More →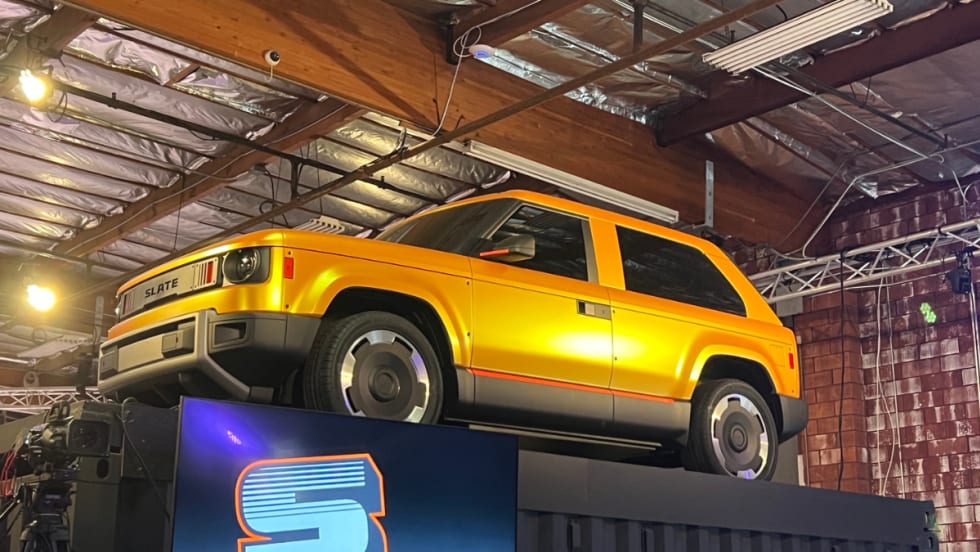
Slate Electric SUV, Pickup Switchable Model Aims For Light-Duty Fleets
Everything about this EV is counterintuitive and understated, making it stand out from the crowd.
Read More →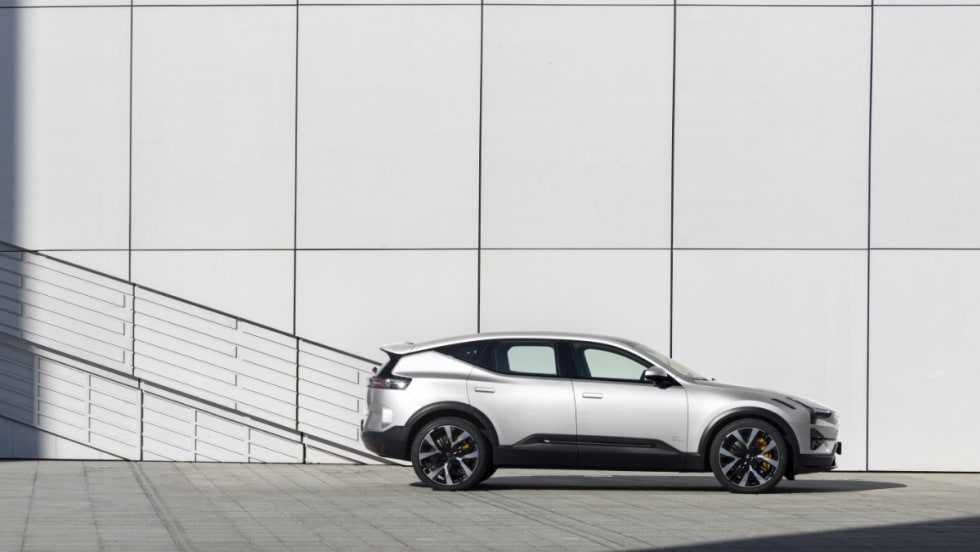
Polestar Barred from U.S. Market Under Connected Vehicle Rule
The automaker loses its authorization to sell new vehicles in the U.S., starting with the 2027 model year. Polestar owners will retain access to the brand's service network.
Read More →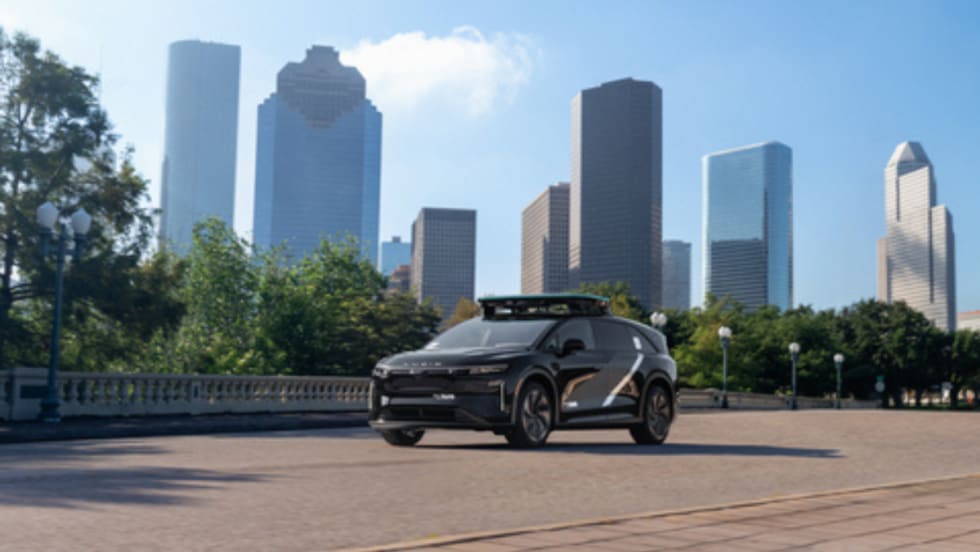
Uber, Nuro and Lucid Plan Houston Robotaxi Service in 2027
The tripartite venture brings out the combined advantages of electric vehicles, mobility, and autonomy into ground transportation.
Read More →