
Closer Look: Buying vs. Leasing Electric Vehicles: Pros & Cons
EV Parity with ICE Vehicles - Are We Making Progress?
J.D. Power's new Electric Vehicle Index uses data and analytics to measure the path to EV adoption and how far we've come to parity with gas-powered vehicles.
January 17, 2023

J.D. Power announced the introduction of the J.D. Power's new analytics tool will keep track of the U.S. EV market.
Photo: Canva
3 min to read
J.D. Power introduced on Jan 17 the J.D. Power EV Index, an analytics tool to track the growing electric vehicle market in the U.S.
Each month, the index will arrive at one number (on a 100-point scale) to make it easy to understand the progress to parity of EVs with traditional internal combustion engine (ICE) vehicles, according to the company's news release.
J.D. Power said the sub-category numbers will represent all the roadblocks to parity. The EV Index score is 47 (based on the most recent available data from November 2022), with some categories improving and others declining during the 12-month pilot period. The EV Index score and accompanying analysis will be available monthly.
“Vehicle electrification has industry leaders grappling with billion-dollar decisions, and hyper-detailed data and analytics will help guide their decision-making,” said Elizabeth Krear, VP of electric vehicle practice at J.D. Power. “We’ve created a smart and dynamic way to capture how the EV marketplace is performing in relation to gas-powered vehicles, and the index provides a heightened level of detail never seen before in this arena.”
Millions of data points are aggregated into six specific categories to make up the EV Index:
Interest—This factor measures the potential commitment to purchasing an EV based on the voice of the customer and online behavioral data. The Interest score is 32, up eight points from a year ago in the pilot phase, due largely to the growing number of EV models available or soon coming to market.
Availability—This factor measures the proportion of new-vehicle buyers who have an EV purchase option that meets their buying needs, reflective of factors like price, manufacturer origin, segment, and other inputs. The Availability score is 30, up 12 points year over year due largely to the ongoing introduction of EV models into new and important segments.
Adoption—This factor measures the proportion of new-vehicle buyers who purchase an EV, relative to those with a viable substitute meeting their needs. The Adoption score is 22, down four points from a year ago primarily because the expansion of EV model availability is outpacing EV retail share.
Affordability—This factor measures the total cost of ownership of an EV compared with the ICE segment average (after tax credits, rebates, incentives, operating costs, and residual values—for both purchase and lease transactions). The Affordability score is 84, down 12 points year over year as EV prices have increased and 15 models were disqualified beginning in August when the Inflation Reduction Act’s North America manufacturing criteria kicked in. The Affordability score is expected to change based on January 2023 data as the manufacturers’ volume cap is lifted, but vehicle price thresholds and income limits are factored into the purchase of an EV. Leasing, which is currently at 10%, also is expected to grow because the criteria are less restrictive for leasing.
Infrastructure—This factor measures the availability, location, speed, quality, and reliability of EV charging compared with gas stations for ICE vehicles. The Infrastructure score is 27, down four points year over year primarily because the volume of EV units in operation is outpacing the rate of reliable charger installations.
Experience—This factor measures owners’ overall satisfaction with their EVs, including appeal, quality, durability, range, and sales and service experiences, as compared with an ICE vehicle equivalent. The Experience score is 89, down two points from a year ago due largely to declining satisfaction with the EV sales experience.
The EV Index for the U.S. market enables industry stakeholders to navigate the EV environment with real-time data that is plugged into a web-based portal. The portal is equipped with a dashboard and a custom query tool that can help stakeholders make more reliable decisions.
The new service also includes substantially increased data granularity in which metrics are available at the national, regional, state, and Designated Market Area (DMA) levels, and can be broken down by segment, brand, and model.
Originally posted on Automotive Fleet
More Electric Vehicles

California Governor Approves Instant ZEV Rebates For First-Time Buyers
That instant rebate is the centerpiece of a broader $600 million package Governor Newsom signed into law, keeping California active in the global clean transportation race.
Read More →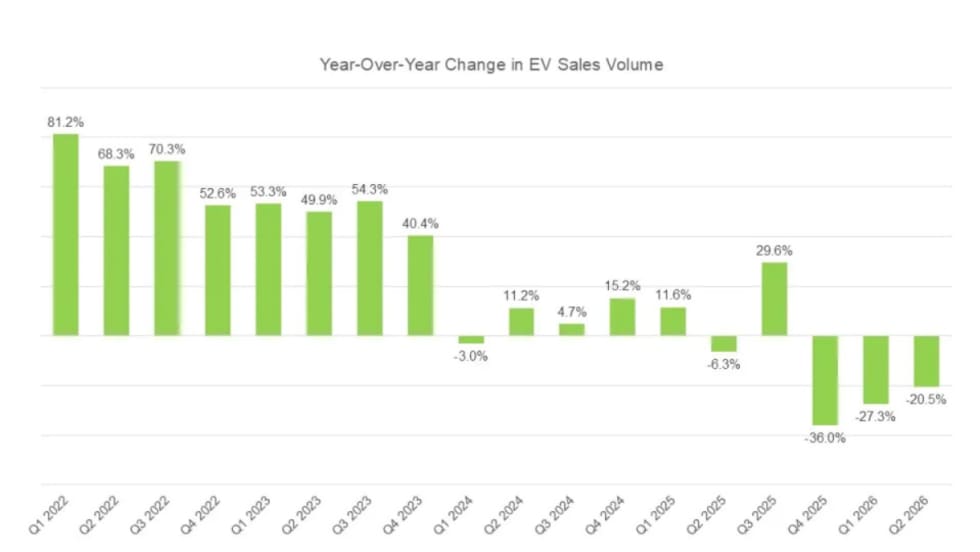
New Vehicle Models Stabilize Electrified Market In Q2
But more credit goes to hybrids than to all-electric vehicles, as more buyers look for fuel-efficient alternatives amid high gas prices.
Read More →
Xos White Paper Asserts LA Olympics Will Lack Enough EV Chargers
The commercial EV fleet company recommends some faster and more flexible remedies to relieve the anticipated shortfall.
Read More →
ChargePoint, Optimus Expand Fast-Charging Network Across Southeastern U.S.
ChargePoint will serve as the exclusive solutions provider, delivering hardware, software, and services to support Optimus’ growing charging network.
Read More →
Running A Profitable Electric Rental Fleet
How do you successfully operate an all-electric rental car fleet? Whether you manage a rental fleet or another commercial fleet, this conversation offers practical lessons on deploying, operating, and scaling electric vehicles.
Read More →
Why Charging May Never Be As Easy As Filling Up Gas
A seamless charge depends on a string of independent companies getting it right together, every time. How can electric fleets navigate the challenges to create a successful charging plan?
Read More →
Slate Debuts Colorful, Unique EV Models
A recent media and client event, studded with electric vehicles dressed up on platforms, planted a new position for the manufacturer in the wider EV market. Fleets will find cost-saving advantages.
Read More →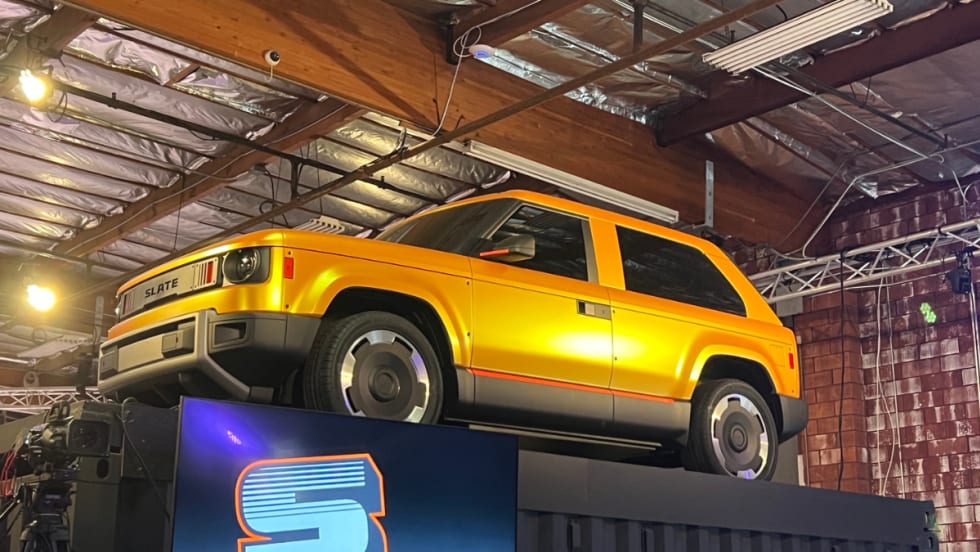
Slate Electric SUV, Pickup Switchable Model Aims For Light-Duty Fleets
Everything about this EV is counterintuitive and understated, making it stand out from the crowd.
Read More →
Polestar Barred from U.S. Market Under Connected Vehicle Rule
The automaker loses its authorization to sell new vehicles in the U.S., starting with the 2027 model year. Polestar owners will retain access to the brand's service network.
Read More →
Uber, Nuro and Lucid Plan Houston Robotaxi Service in 2027
The tripartite venture brings out the combined advantages of electric vehicles, mobility, and autonomy into ground transportation.
Read More →