Which EVs Have the Lowest Total Cost of Ownership for Fleets?
Included in this groundbreaking total cost of ownership study for fleets are battery-electric models including BMW i3, Chevrolet Bolt, Nissan Leaf, and Tesla 3, as well as plug-in hybrid electric models such as Chevrolet Volt and Hyundai Ioniq Plug-In Hybrid.

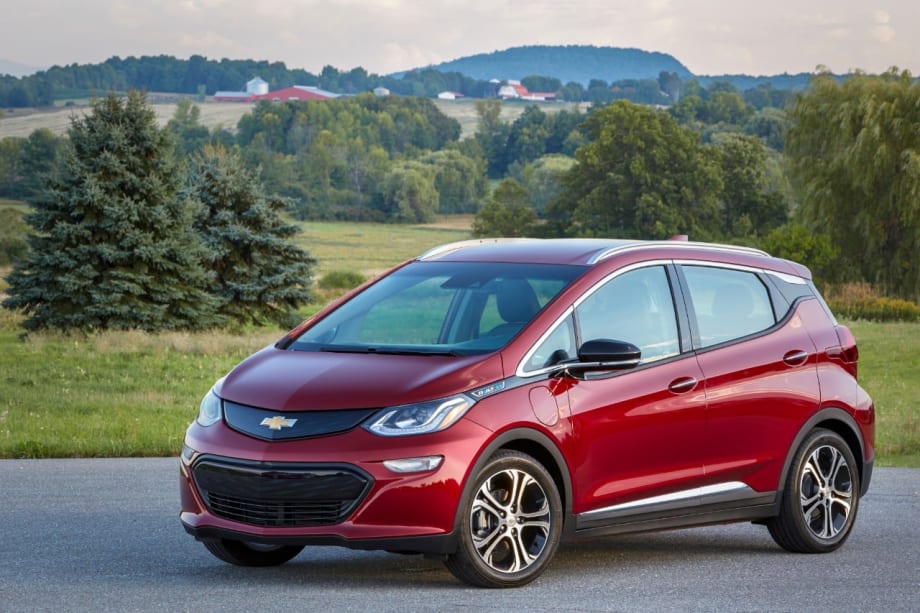
The 2019 Chevrolet Bolt battery-electric vehicle currently enjoys a $500 manufacturer’s rebate and a $3,750 federal rebate. Factoring in Vincentric’s eight cost elements, the Bolt’s total operating costs run $28,329, or $.63 cents per mile, after 36 months and 45,000 miles.
Photo via GM.
When consumers consider acquiring an electric vehicle, the usual concerns about range, charging infrastructure, and initial costs come up. For fleets, this equation is missing a key variable — depreciation. Understanding the value of a vehicle in the secondary market, of course, allows for a calculation of total cost of ownership (TCO) of any vehicle’s life in service.
Electric vehicle models have accumulated enough miles to reach the secondary market in enough quantities to produce reliable residual values. With that in mind, we collaborated with Vincentric, the lifecycle cost experts for fleets, to see how TCO for battery electric vehicle (BEV) models and plug-in hybrid electric vehicle (PHEV) models stacked up against each other and against a selection of comparable models with internal combustion engines (ICE).
For the analysis, Vincentric calculated its standard eight cost elements: depreciation, financing, fees and taxes, fuel, insurance, maintenance, opportunity cost, and repairs. This analysis covers 2019 models over a 36-month period and 15,000 miles a year.
In attempting to produce reliable TCO numbers for electric vehicles we must first note the many variables that make real-world comparisons more complicated than those for ICE models.
For fleets (and consumers), availability of certain electric models varies widely by manufacturer and state. Recently, automakers are showing signs they’re loosening up to fleet sales and are offering attractive subvented lease deals.
Electric models also enjoy federal rebates, which are crucial to lowering electric vehicles’ TCOs. The initial rebate of $7,500 diminishes as models reach sales stairsteps. Most models in this analysis have seen a reduction in federal rebates.
State programs provide grant money for fleets, though the majority are concentrated in West Coast states. Grants cover a good portion of the premium for electric vehicles; applying grant money changes the TCO cost equation yet again. Grants were not included in these calculations.
Comparing costs for fuel, or more broadly “power,” for three propulsion types (ICE, BEV, PHEV) is an inexact science. For an apples-to-apples comparison, we needed to apply a uniform yearly mileage; however, BEVs and PHEVs are chosen based on duty cycles that best fit their ranges.
For instance, for a commute of fewer than 25 total miles per day a consumer might opt for a PHEV with an all-electric range of 25 miles, such as the Prius Prime. Yet our 15,000-yearly mileage that was applied to all models forces the PHEV models to run on gasoline more than they might in the real world.
As well, we assume that fleets can charge their BEVs without hindrance. The prevalence or lack of charging infrastructure is a key factor to acquiring BEVs above and beyond cost considerations.
Electricity costs fluctuate depending on grid, time of day, and whether charging from a public or private station. For this analysis we were forced to choose a single per-kilowatt amount, which disassociates from real-world results.
To see how Vincentric calculated total fuel/power costs, see below.*
Prime Is Champ: The model with the lowest TCO of any vehicle type — BEV, PHEV, or ICE — is the Toyota Prius Prime, a plug-in hybrid that costs $0.37 per mile for its three years and 45,000 miles in service.
The Prius Prime enjoys low cost factors across the board, including a federal rebate, factory incentive, and low overall fuel costs when on battery/electric propulsion. But the importance of depreciation, the largest ownership cost, cannot be overstated. The Prius Prime has lowest depreciation of any model in this analysis.
Electrics Take Top 10: The next two models in order of lowest TCO are also PHEV models: Hyundai Ioniq Plug-In Hybrid and Kia Niro Plug-In Hybrid. The BEV Nissan Leaf placed fourth, followed by two Prius gas/hybrid models: the Toyota Prius L and higher trim-level LE. The Hyundai Ioniq Electric, Honda Clarity Plug-In Hybrid, and Kia Optima (ICE version) round out the Top 10.
Rebates Matter: The Top 10 list looks a lot different without the electric federal rebates. With those rebates left out, the Prius Prime still ranks first, though the Hyundai Ioniq Plug-In Hybrid drops to fifth, and the Top 10 is taken over by ICE vehicles. Without federal rebates, TCO suffers more for BEVs than for PHEVs.
Luxury Suffers: We included luxury and near-luxury PHEV models from Volvo, Porsche, Mercedes, and BMW. Those models cluttered the bottom of the cost rankings, though we note that their ICE counterparts have similarly large costs per mile as well.
Mixed Bag for Teslas: Looking at rankings by BEV only, the Tesla Model 3, Model X, and Model S took eighth, tenth, and eleventh out of 11 BEV models.
The Teslas rank at the lower end of the BEVs, but when comparing the Model S and X against their PHEV luxury counterparts, they placed at the top of the list — due primarily to very low depreciation, which usually suffers steep declines when it comes to luxury models. (Note that we chose the engines with the longest ranges.)
Best Value? Non-Luxury PHEVs: Sorting the models by group — BEV, non-luxury PHEV, luxury PHEV, and ICE — the non-luxury PHEVs enjoyed the lowest TCO on average. While enjoying great depreciation, they also deliver great fuel economy when in hybrid/electric mode, in addition to their all-electric ranges. Their luxury PHEV brothers do not.
Depreciation? ICE Still Wins: As a group, the ICE models (non-luxury) averaged the lowest depreciation, followed by PHEV (non-luxury), BEVs, PHEV (luxury) and ICE (luxury).
In this analysis, the BEV models fare surprisingly well in overall TCO ranking, despite the negative impact of depreciation.
As a group, the BEV models suffered 38% worse depreciation on average than our selection of traditional ICE vehicles (non-luxury) models. But the BEVs recoup some savings when factoring in great “fuel” and maintenance costs. Again, federal rebates are essential to delivering lower TCO for BEVs. If removed entirely, the standard ICE models fare much better.
Breakthroughs in battery technology and implementation of charging infrastructure should help TCO moving forward. Battery progress has been made, though ironically this could be negatively affecting BEV resale values. The secondary market for first-generation BEVs that can travel 80 miles on a charge, compared to models achieving over 200 miles today, is small.
Another wildcard variable that may drive BEV adoption, but not necessarily for fleets — Tesla made the heart-pounding, white-knuckle Ludicrous Mode, once a $20,000 option, free on Model S and X Performance models.
The PHEV non-luxury models cluster near the top of TCO, which might be the most surprising takeaway from this analysis.
True, the emissions benefits of PHEVs are mitigated by the fact that they run a percentage of the time on gasoline. (Then again, running a pure electric vehicle is not 100% emissions free as well.) Nonetheless, PHEVs are a cost-effective option for fleets looking to reduce their carbon footprints.
With so many outside variables and a fast-changing market, this analysis should be considered directional at best. At the very least, TCO data is now available to base some assumptions.
Editor's note: At the 2019 Fleet Forward Conference, Vincentric is teaming with Kelley Blue Book to present an electric vehicle TCO and market analysis.
*Vincentric’s fuel/power cost calculations:
For electric vehicles, Vincentric’s method takes the annual driving distance and divides it by 365 days to determine a daily driving distance. Vincentric then divides that driving distance by the range to determine the number of battery charges required per day and multiply that by the annual miles to determine the charges required for the year. Once we have the number of charges, Vincentric multiplies that value by the electricity price.
For regular gas/hybrid vehicles (not plug-in), Vincentric takes the annual driving distance and divides that value by 12 to determine the monthly driving distance. After accounting for the fuel economy, Vincentric multiplies the gas quantity needed by the monthly fuel price (including inflation). Fuel was calculated at $2.74 per gallon of regular gasoline and $3.31 of premium where required.
Plug-in hybrids use a combination of both methods. Vincentric determine the daily driving distance, similar to the approach taken for the electric vehicles, and then after allocating the daily distance first to electric and then the remainder to gas, we branch off into the calculations explained above.
Electricity prices are derived from Electric Power Monthly's "Average Price of Electricity,” which is found on the U.S. Energy Information Administration site. We use the residential average for the U.S. and each individual state to determine electricity price.
Model types are ranking by color:
Battery Electric Vehicles (BEVs): Blue
Plug-in Hybrid Electric Vehicles (PHEVs), Non-Luxury: Green
Plug-in Hybrid Electric Vehicles (PHEVs), Luxury: Orange
Internal Combustion Engine (ICE) Vehicles: Yellow
Originally posted on Automotive Fleet
More Suppliers

Slate Debuts Colorful, Unique EV Models
A recent media and client event, studded with electric vehicles dressed up on platforms, planted a new position for the manufacturer in the wider EV market. Fleets will find cost-saving advantages.
Read More →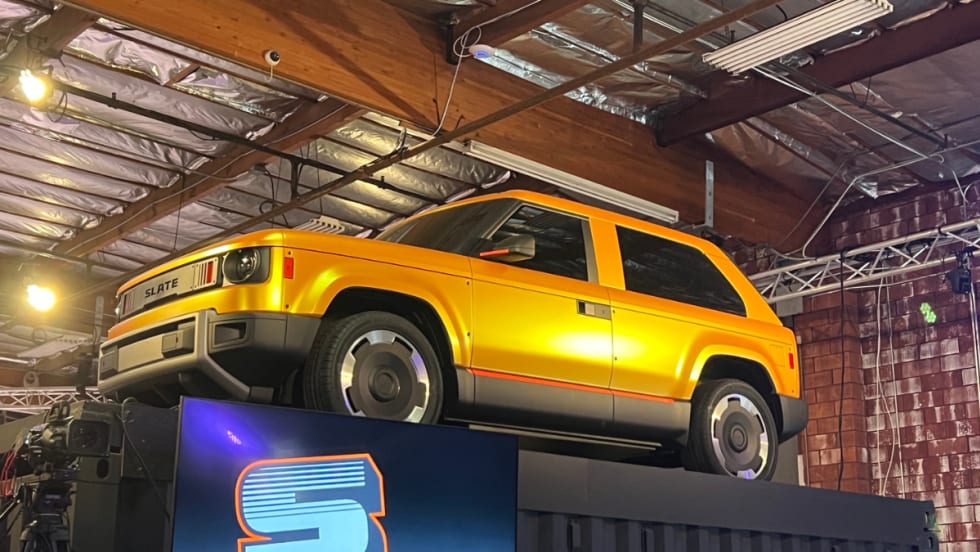
Slate Electric SUV, Pickup Switchable Model Aims For Light-Duty Fleets
Everything about this EV is counterintuitive and understated, making it stand out from the crowd.
Read More →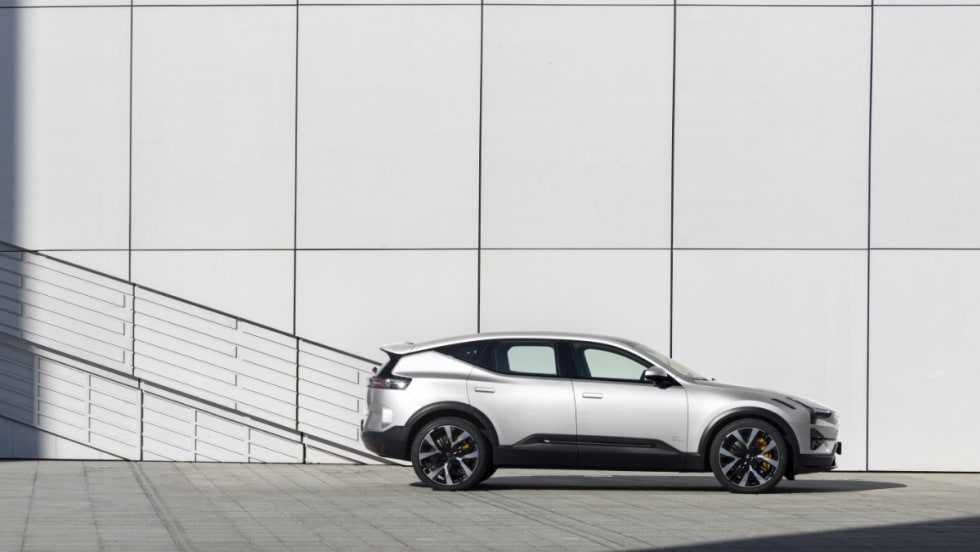
Polestar Barred from U.S. Market Under Connected Vehicle Rule
The automaker loses its authorization to sell new vehicles in the U.S., starting with the 2027 model year. Polestar owners will retain access to the brand's service network.
Read More →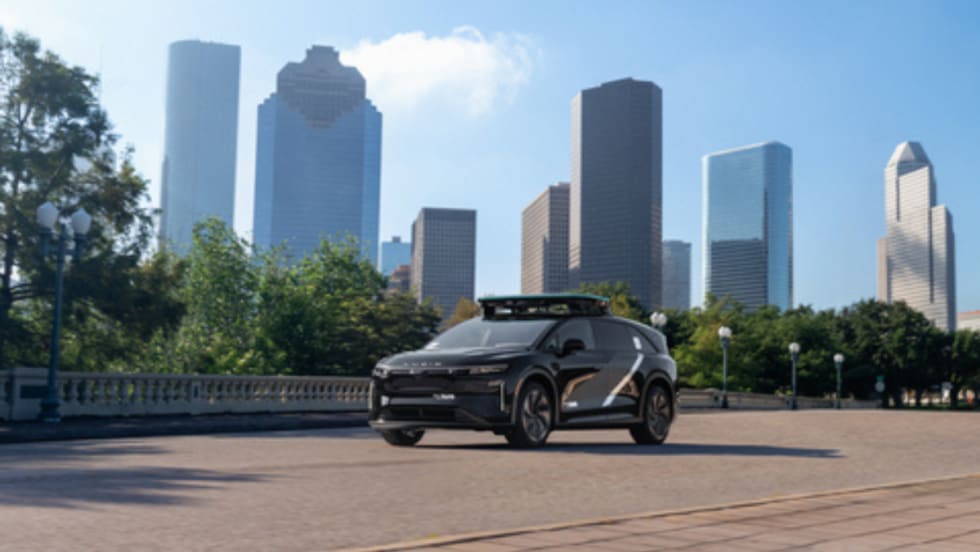
Uber, Nuro and Lucid Plan Houston Robotaxi Service in 2027
The tripartite venture brings out the combined advantages of electric vehicles, mobility, and autonomy into ground transportation.
Read More →
Electrify America Opens EV Fast Charging Station in Southern California
The large-format depot features 20 hyper-fast chargers capable of delivering 350 kilowatts and is backed by a powerful battery energy storage system.
Read More →
Inspiration Mobility Acquires Key Electrada Assets
Inspiration Mobility Group has acquired select assets of Electrada, adding the fleet electrification provider's team, technology, and charging infrastructure development capabilities to its energy management business.
Read More →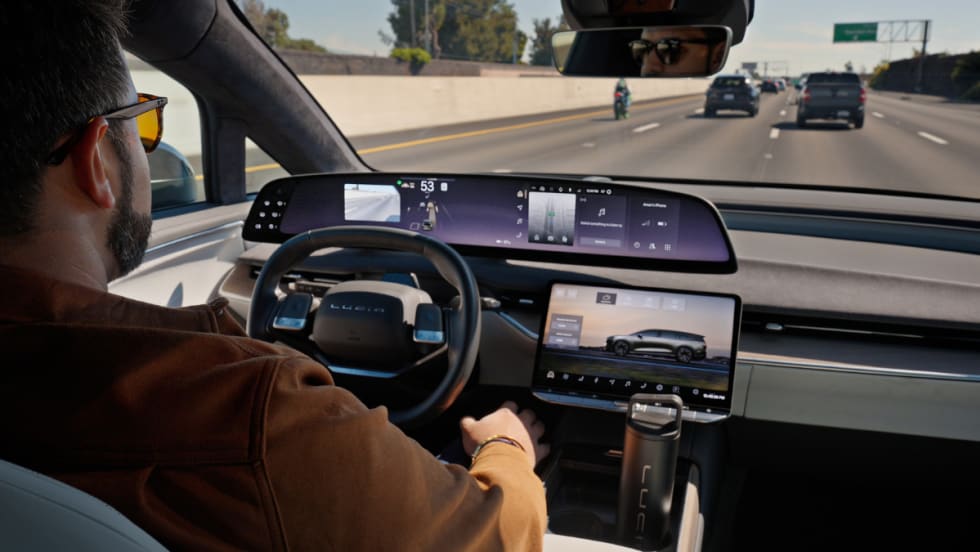
Lucid Adds Hands-Free Highway Driving, Software Updates To Gravity SUV
Hands-free drive assist makes highway driving more comfortable while keeping drivers attentive to the road.
Read More →
Harbinger Creates Hybrid-Electric Unmanned Vehicle Platform for Defense Use
The platform is based on the company's medium-duty plug-in hybrid chassis, which is also used in commercial vehicles.
Read More →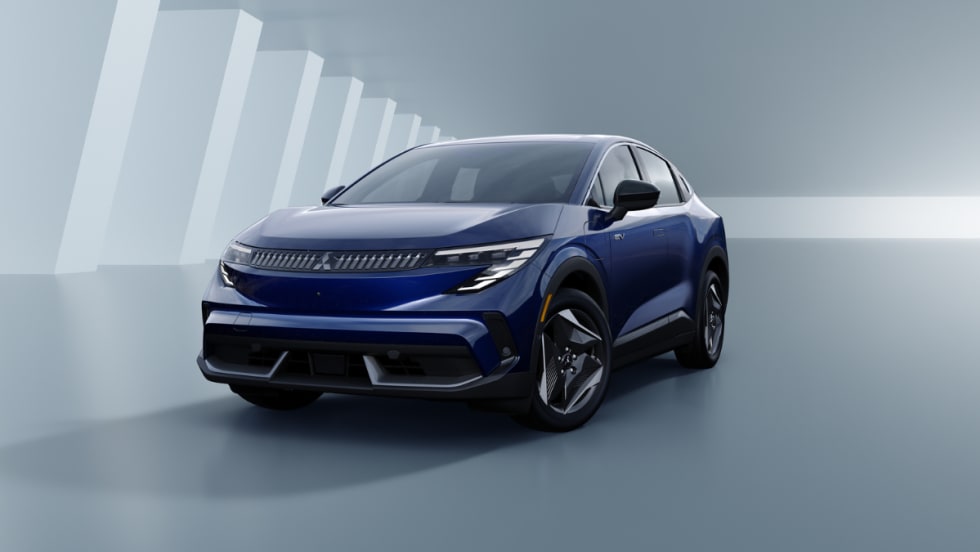
Mitsubishi To Debut All-Electric Eclipse Subcompact For North American Market
The 2027 Mitsubishi Eclipse Sportback is a small SUV that will go on sale by this fall.
Read More →
Stellantis To Build Smaller, Affordable EVs For European Market
Stellantis aims to expand access to urban EV mobility in Europe and address the decline in the smaller-vehicle segment.
Read More →